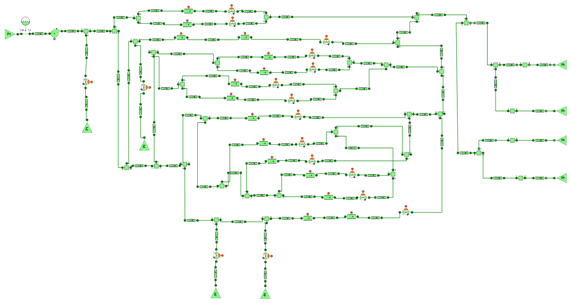
The purpose of this user case is to study the pressure balancing and the flow distribution of an Essential Service Water System of a Nuclear Power Plant. The following figure shows the schematics diagram of the model.
The model of this system was connected to MS Excel spreadsheet in order to easily report analyses changing the following parameters:
• Positions of the valves
• Thermal loads of the equipments
• Boundary conditions of the system (temperature, etc)
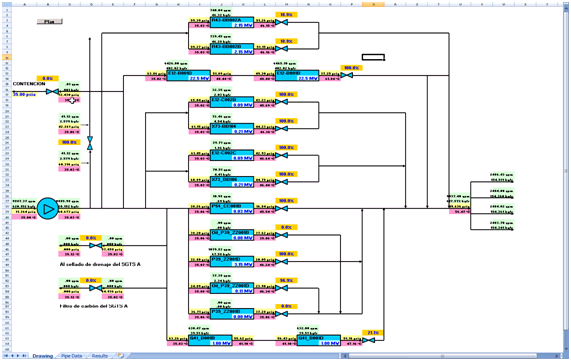
The model represents the low pressure feed water system of a combined cycle power plant. The model includes two pumps in parallel (the running one and the spare one) that provides water to the suppliers. Both pumping trains consider the minimum circulating flow and the attemperation water flow is regulated with a PI controller.
The schematics diagram of the simulation model is depicted in the following figure. This model shows the capability to include control logics of the hydraulic system.
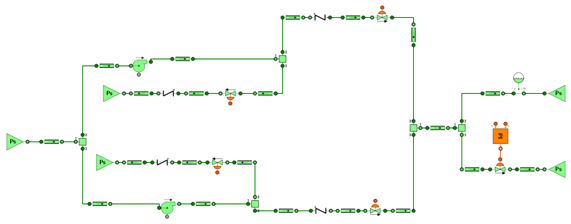
The scenario analyses the start-up of one of the pump according to a predefined start-up curve and the required attemperation water flow as a function of time using look-up tables.
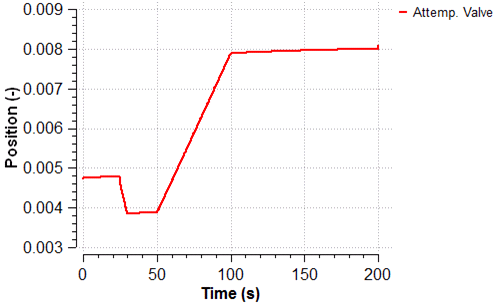
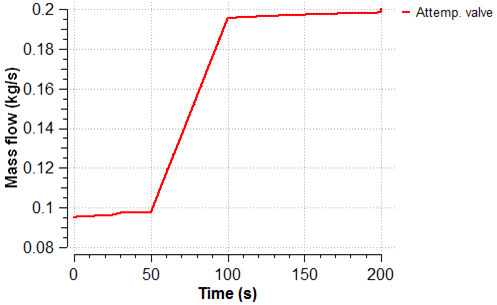
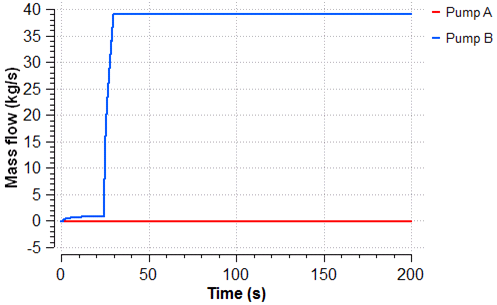
The following plots show the evolution of the water flow supplied by the pump, the attemperation water flow, the behavior of the control loop and the position of the control valve during the start-up of the pump.
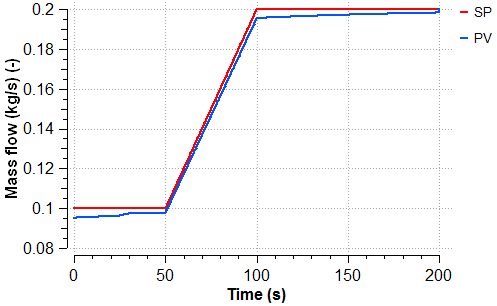
As the required mass flow across the atemperation line is greater, the valve is gradually opened as depicted in the following figure.