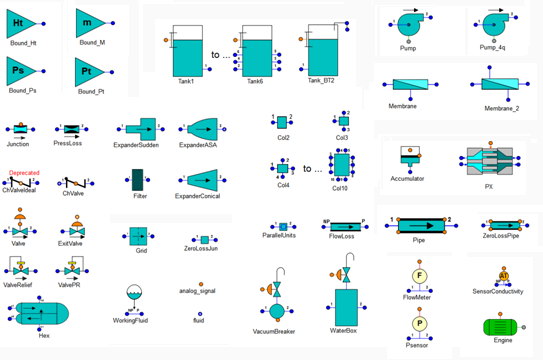
PIPELIQTRAN is a toolkit for the simulation of liquid pipe networks linked with controlled devices like valves, pumps, tanks, heat exchangers, osmotic membranes, etc. It has been developed and validated against experimental test results. The PIPELIQTRAN toolkit provides a palette of components (represented by symbols) that can be used to build graphically complex systems. Figure below shows the PIPELIQTRAN palette of symbols.
PIPELIQTRAN is a toolkit designed to analyze:
- Thermo-hydraulic analyses including water hammer and pressure surge phenomena in liquid piping networks, taking into account:
- Sizing and optimization of pipe networks (diameters, pressure losses, etc)
- Selection of pumping systems (energy optimization, NPSH analysis, etc))
- Selection of surge control device
- Selection of control valves and actuator speed limiter
- Design and tune the control system
- Pressure transient analyses. Calculation of pipe waves forces
- Simulation of mechanical desalination (reverse osmosis) plants. Ditto as before, plus:
- Components simulating Pressure Recovery devices
- Components simulating osmotic membranes
- New Tank components also calculating the spillover of liquid
PIPELIQTRAN features:
- Working fluid (currently water or sea water, but new fluids will be added in next releases) is a liquid with built-in properties depending on the temperature
- Calculation of concentrated pressure losses (fittings, valves, etc.) and distributed friction (Pipes). The specification of the pipe elevations and the pressure losses along the pipes is easily managed by the EcosimPro/PROOSIS input data editors
- Transients originated by changes on the rotation speed of pumps, in valves position, etc. The Pressure waves calculation is also included
- Heat accumulation in the liquid and in the pipe walls
- Mixing of currents with different salinity. Calculation of the water production through osmotic membranes
- The toolkit allows the simulation of vapour bubbles formation in the pipe’s nodes when the local pressure is lower than the vapour one
- Pressure and flow transients due to entrance and exit of Air in a pipe network (vacuum breakers and water boxes components are available in the Library)
- The process control system can be easily included in the simulation model using the standard CONTROL library supplied with EcosimPro/PROOSIS
This user case involves the fluid transient analyses in a circulating water system of a combined cycle power plant. The schematic diagram of the simulation model is depicted in the following figure.
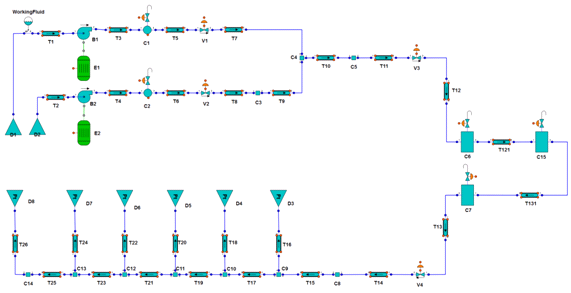
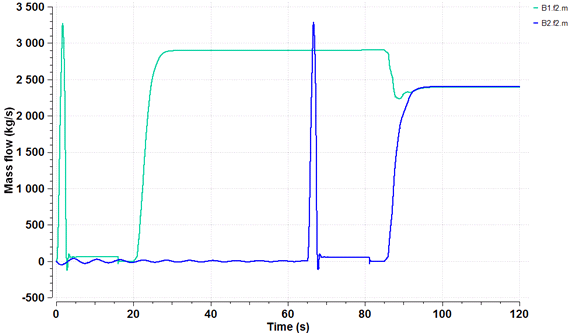
The case consists of the sequential startup of both pumps with the system full. The purpose of this analysis is to check the correct opening time of the pump relief valves so that system pressures do not exceed the maximum allowable pressure. The opening time of the valves is 10 seconds. The relief valve of pump B1 starts to open at 20 s and that of pump B2 at 85 s. The first pump, B1, is connected during the first instant, whereas pump B2 is connected after 65 s. Vacuum breakers C1 and C2 have an initial air volume of approximately 5 m3.
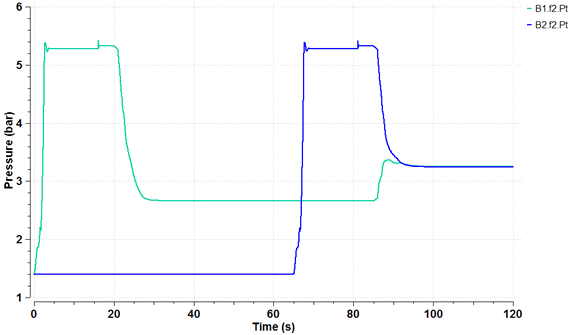
The following plots illustrate the evolution of the discharge pressures of both pumps and the mass flow circulating through them.
EcosimPro and the PIPELIQTRAN library have been used to model a large reverse osmosis desalination plant with a maximum output of 16,000 m3/h . The simulation will allow startup and shutdown sequences to be studied with a view to guaranteeing plant stability. The plant is hydraulically complex for several reasons. First because the tanks between the various subsystems are not large enough, there is a strong hydraulic coupling between them. Second because the existence of several lines that operate in parallel, and where startup/shutdown of one of them can affect the stability of the others.
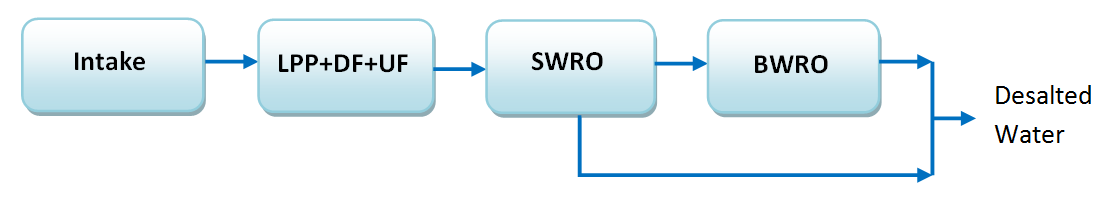
The modelled desalination plant has the following subsystems: Intake, Low Pressure Pumping and Pretreatment, LPP+DF+UF, SWRO/RO First Stage, and BWRO/RO Second Stage:
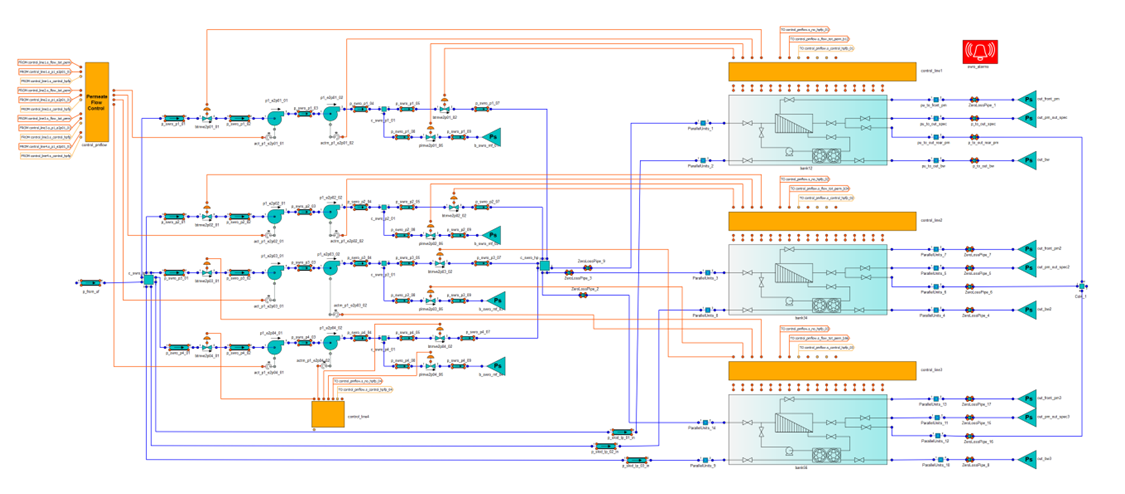
The EcosimPro model includes the hydraulic modelling of the system to adjust design and control parameters, as well as to identify potential operating problems and to test proposed solutions. Hereafter is included the model schematic of the first desalination stage, as taken from the overall model where all the stages are interconnected so that their hydraulic coupling can be studied.
Diagram of the first reverse osmosis stage in EcosimPro:
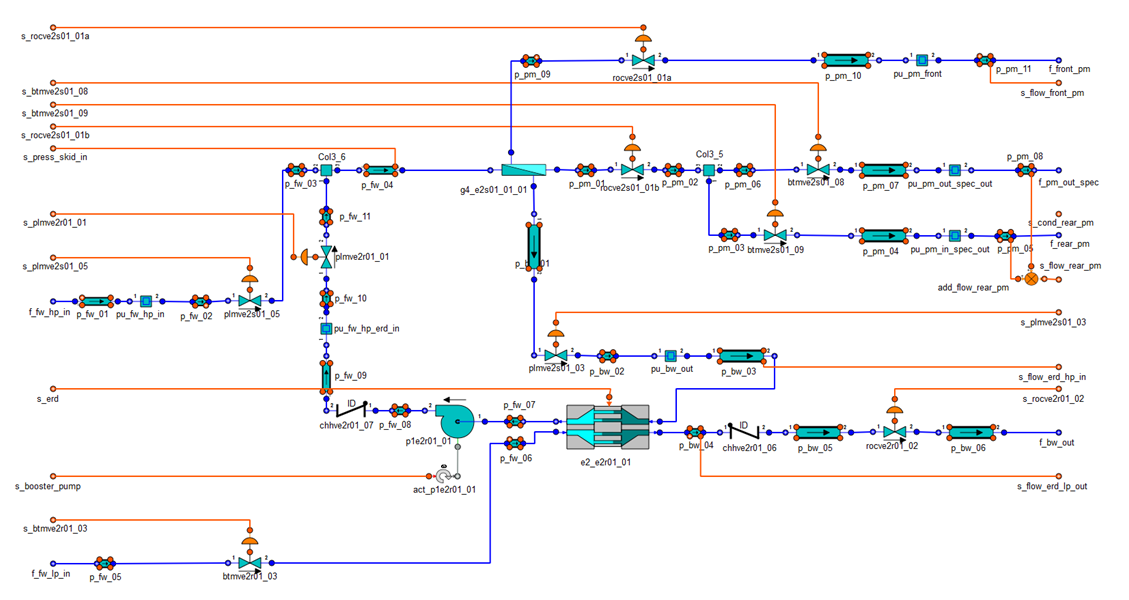
Detailed SWRO sub-model in EcosimPro:
The startup and shutdown of each of these lines is analyzed to study the validity of the established design parameters, as well as to determine operating parameters such as delays in the startup of the various stages or the parameters that define the different control loops. Accordingly, special attention is paid to avoiding pump cavitation and to keeping them below the run-out flow. As an example of the results that can be obtained, we present below some typical results for the start-up of different levels of Plant production:
Intake Pumps flow:

Surge & sea water Pools liquid elevation:
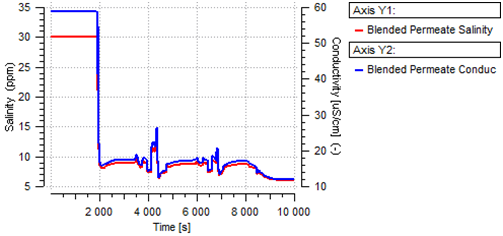
Final Product Salinity:
The objective of this study was to optimize the start-up and stop operation sequence of the Intake Pumping Station of a desalination plant fulfilling the operational requirements. The following figure depicts the model schematics of the system:
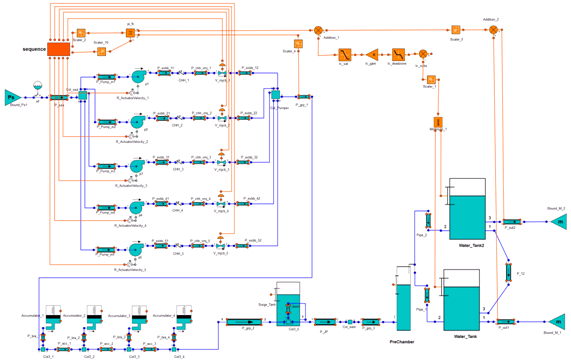
The model includes all the relevant components for the transient simulation of the Intake Pumping system, in particular, pipes, check and discharge valves, pumps, surge tank, accumulators, raw water tanks and overflowing pre-chamber for the correct simulation of the level behaviour. The model also includes the level and flow control loop of the system.
The study has allowed to optimize the control and operational parameters (valve positions and pump speeds) and to confirm the design of the anti-waterhammer devices.
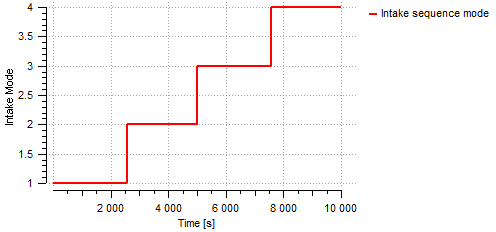
The results shown below correspond to the start-up sequence of the intake pumping system at summer ambient conditions. The following figure shows the upward sequence followed in this scenario. It has been considered that the mode changes every 2500 seconds .
The evolution of the flow-rate supplied by each pump and the run-out flow and the rotational speed are shown in the following figures:
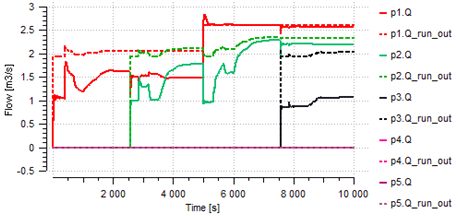
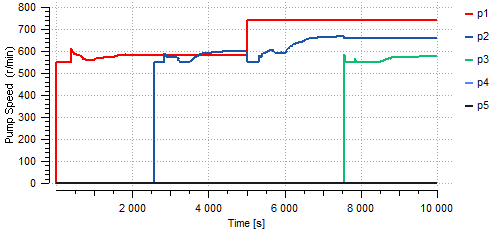
In some operation modes, the pumps are forced to operate close to their run-out curves for the maximum operating conditions.
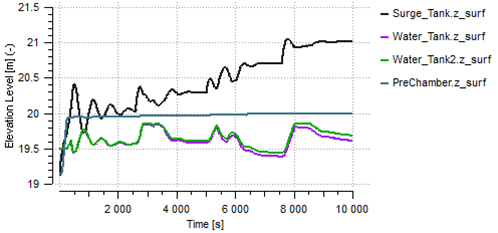
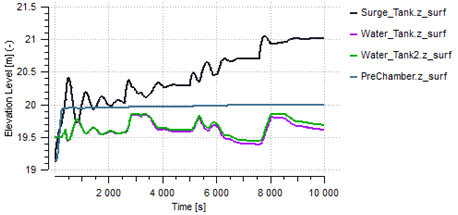
The levels in the raw water tanks remain within acceptable limits as shown below. The oscillation of the tank levels throughout the startup sequence is less than 0.5 m.
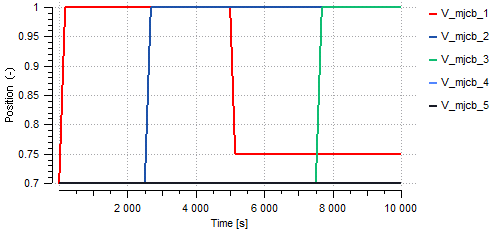
The position of the discharge valves of the intake pumps considered in the start-up simulation scenario are depicted below.
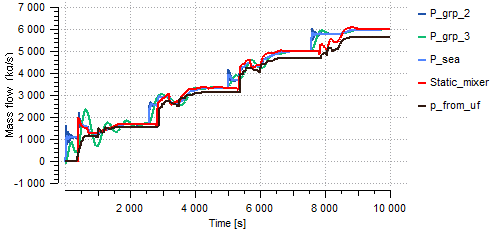
Finally the following figure shows the evolution of the total mass flow at different locations of the system (shore, before and after the surge tank) and the downstream demanded flow (p_from_uf).